This document provides a concise overview of how to manage and analyze shared pages on Trupeer’s platform. Learn how to analyze public or organization-specific shared pages, track their analytics, and engage with your audience effectively.
Step 1
Welcome to the video about shared pages. Shared pages are public pages that you can host on Trupeer’s site, allowing you to track their analytics directly from our platform. We have completely revamped the shared pages feature, so let’s explore its functionalities.
Step 2
On the shared pages section, you will see a list of pages that have been shared publicly. Alternatively, you can choose to share your pages with specific groups, such as only within your organization. This means individuals who share your domain will have access. Let’s explore the example page, “Daily Meme for the Team.”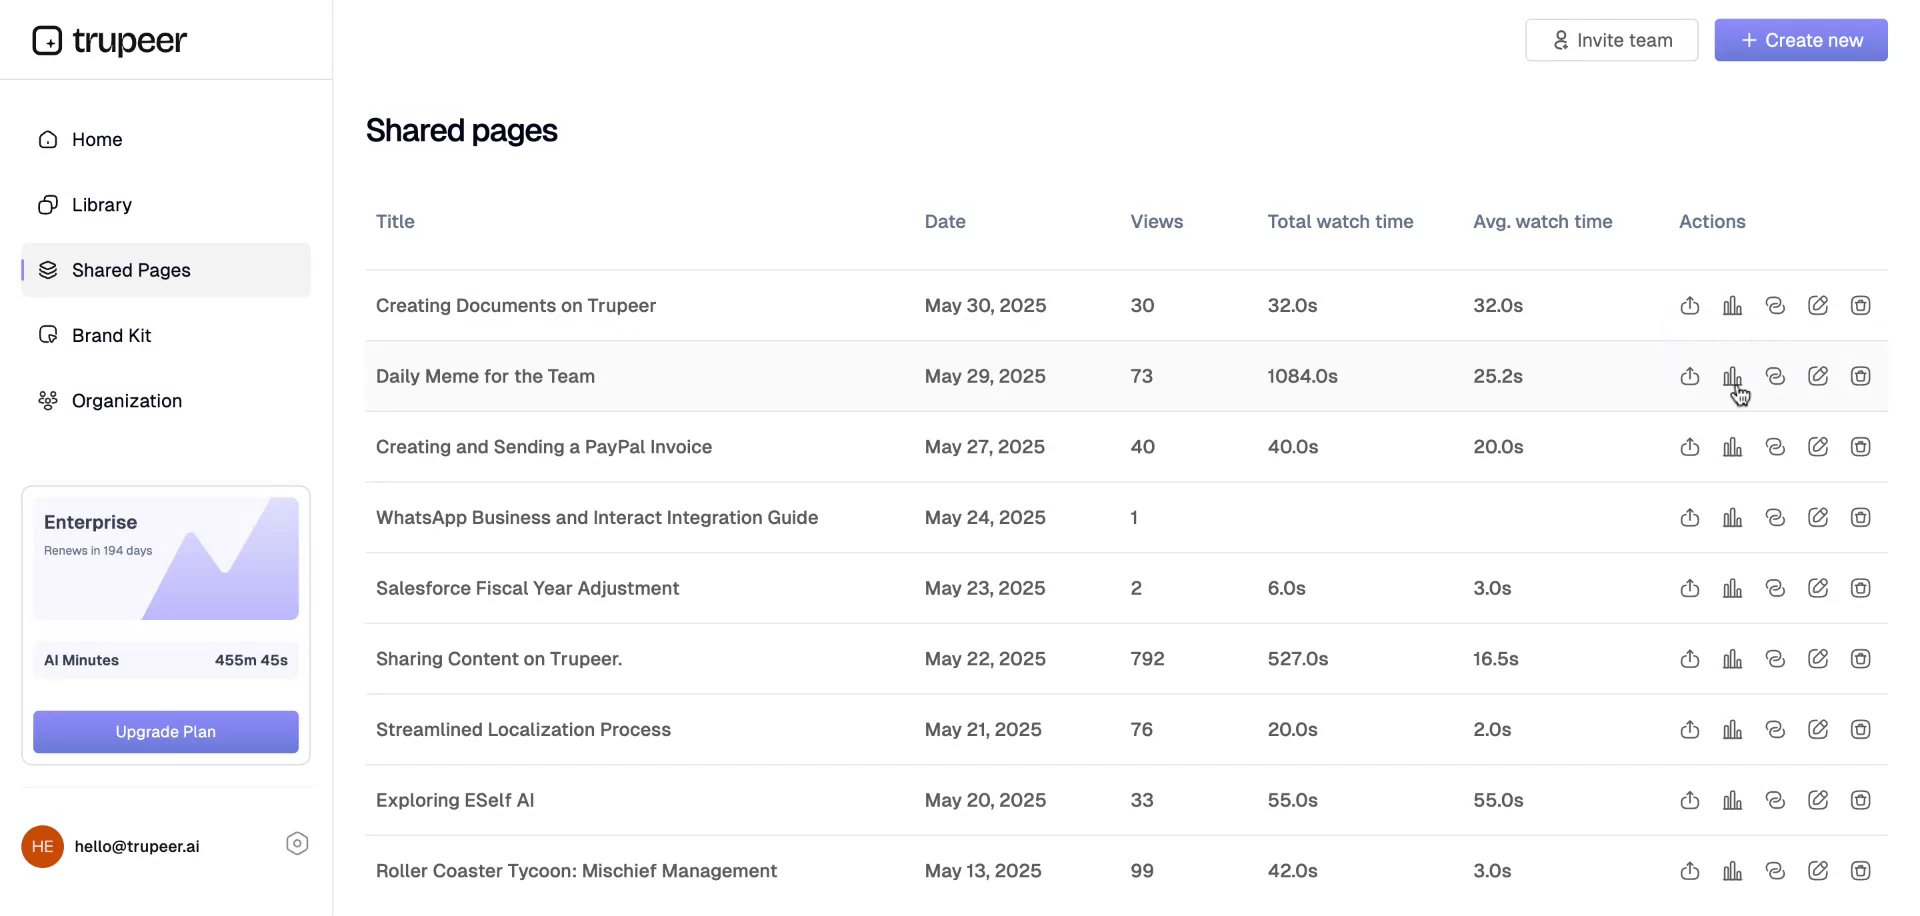
Step 3
Here, we have several options available. Let’s select the “View Analytics” option to proceed.
Step 4
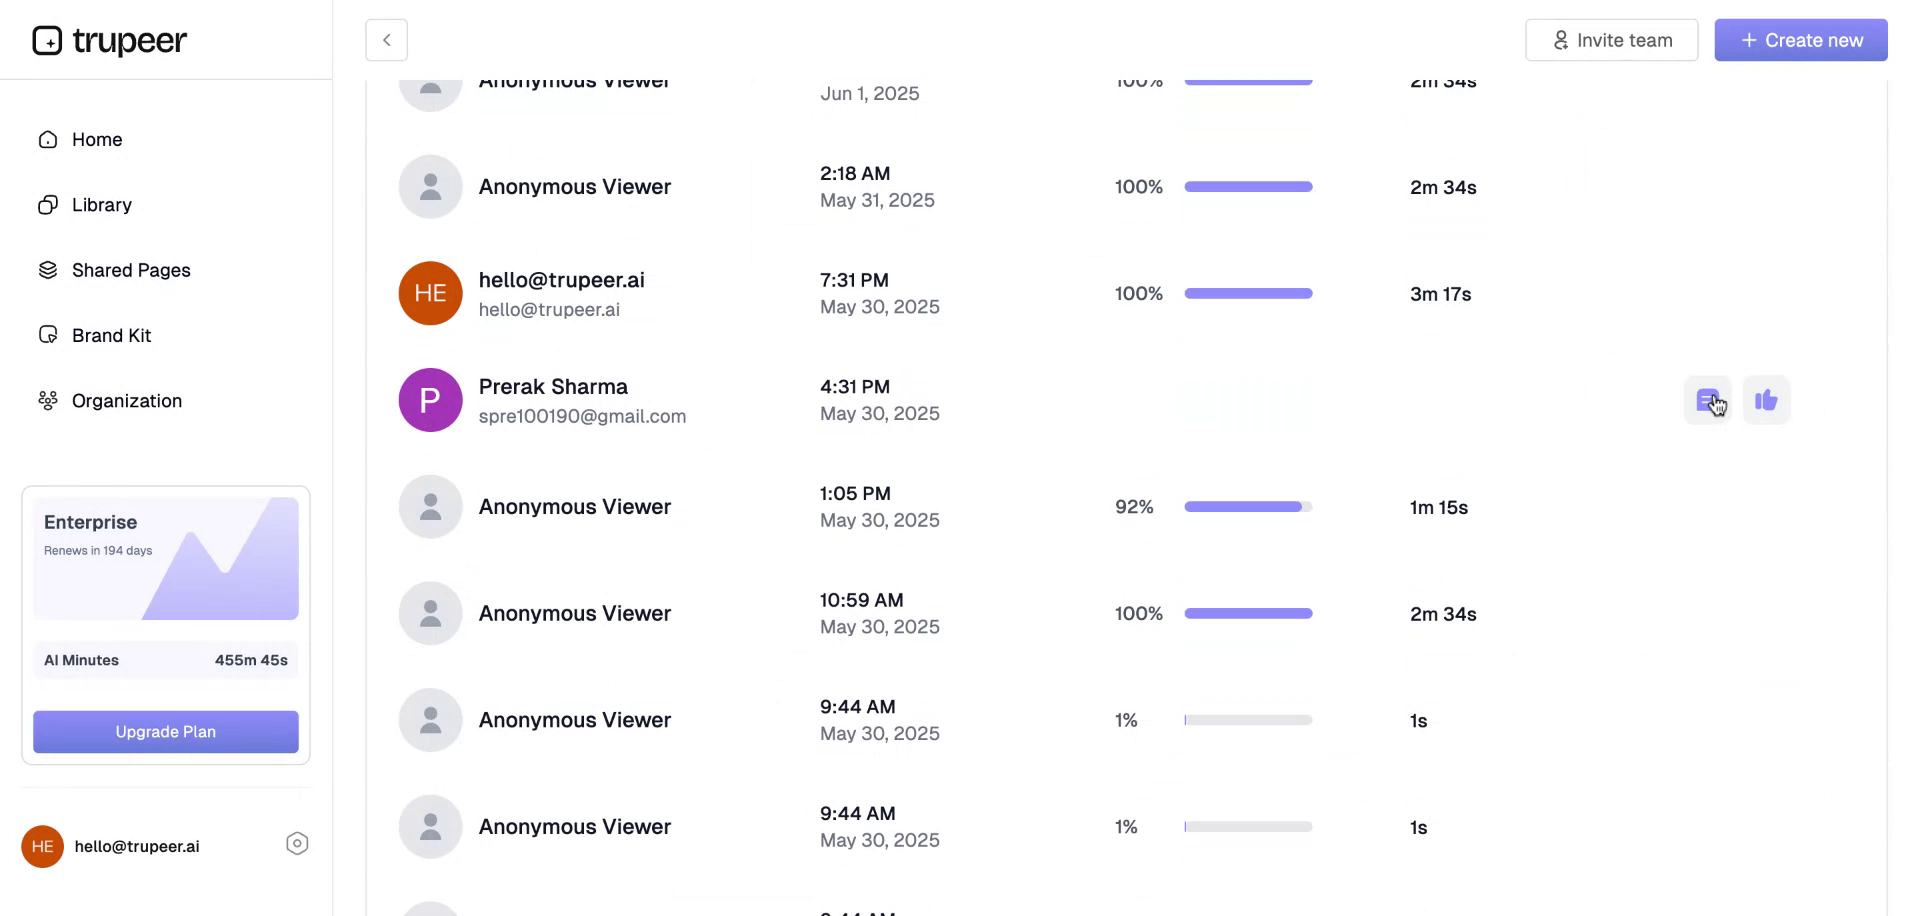
In this section, you can view the total number of views and the average watch time, providing insights into audience engagement. For example, if your video is 60 seconds long but the average watch time is 35 seconds, it indicates viewers are leaving after 25 seconds. You can also review comments, reactions, and retention views, giving you detailed feedback on viewer interaction.
Step 5
The retention view graph shows the percentage of users retained over the duration of the video, starting at time zero. Additionally, the “Identify Users” feature allows you to track email IDs of logged-in users who watch your video, offering more specific insights.
Step 6
If viewers watch your video without logging in, they are tracked as anonymous viewers.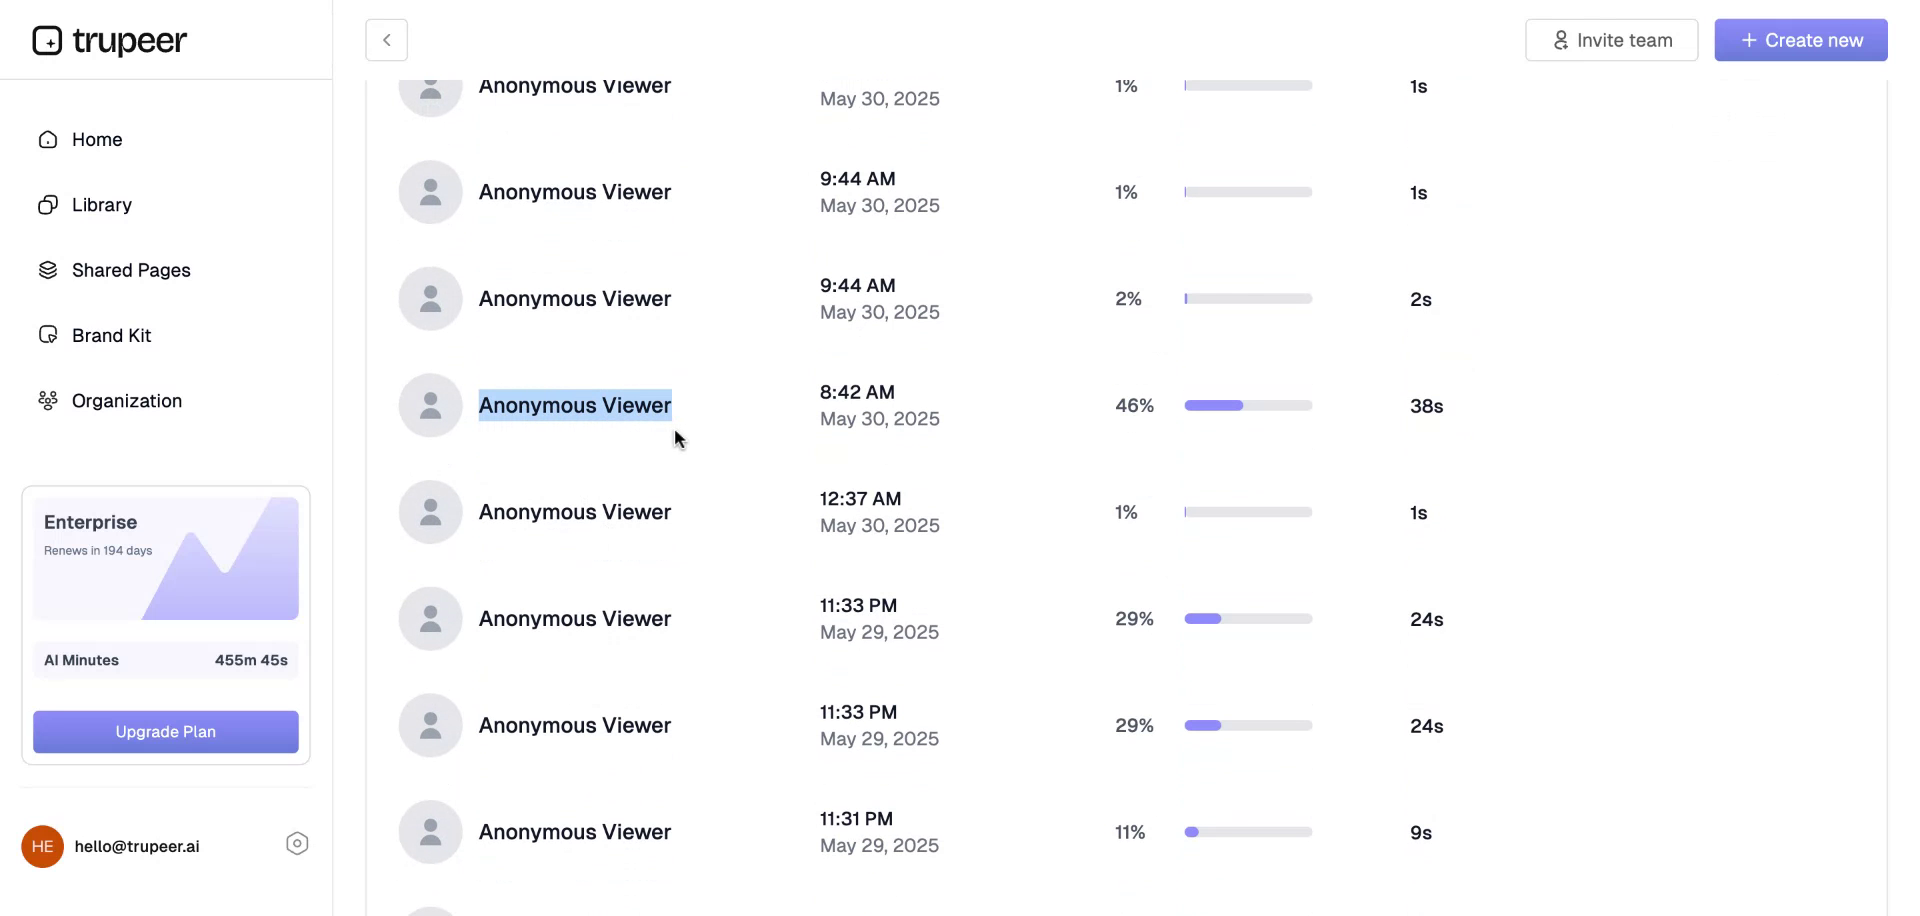
Step 7
You can also check if you can cross-reference a comment or like from a viewer and eventually message them.